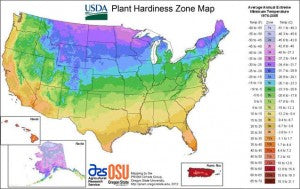

The USDA released their new version of the Plant Hardness Zone Map in January 2012. The new map is generally one 5- degree Fahrenheit half-zone warmer than the previous released map back in 1990. This mostly is a result of using temperature data from a longer and more recent time period. More specifically, it uses data measured at weather stations during a 30-year period from 1976-2005. The 1990 map used data from a 13-year period of 1974-1986.
Another change with the new map is the addition of an interactive “find your zone by ZIP code” function. Click here to see the new USDA Plant Hardiness Zone Map.